The 2025 financial year was a strong year for Australian superannuation. However, headline performance figures often hide the most important details, fees, asset allocation, and control. In this article, we compare retail and industry super fund performance in FY2025 with Self-Managed Super Funds (SMSFs), focusing on: Estimated returns after fees Where money was actually invested […]
The 2025 financial year was a strong year for Australian superannuation. However, headline performance figures often hide the most important details, fees, asset allocation, and control.
In this article, we compare retail and industry super fund performance in FY2025 with Self-Managed Super Funds (SMSFs), focusing on:
-
Estimated returns after fees
-
Where money was actually invested
-
How SMSFs performed across key asset classes such as property, Bitcoin and gold
Contents
-
FY2025 super performance overview
-
Average retail & industry fund returns after fees
-
Retail & industry fund asset allocation
-
SMSFs: average fees and asset allocation
-
SMSF asset performance in FY2025
-
Retail & industry funds vs SMSFs: key differences
-
What FY2025 means for trustees heading into 2026
-
FAQs
-
Related links
FY2025 super performance overview
2025 delivered strong outcomes for most diversified industry fund and retail funds. Global share markets performed well, the Australian dollar weakened, and inflation pressures remain, although headline inflation is reported to have dropped.As a result, most balanced and growth options reported high single digit to low double digit returns. It is important to recognise that these figures are usually quoted before administration fees, which can materially affect the net outcome for members.
Average retail / industry fund returns after fees (FY2025)
Retail and industry funds use pooled investment structures and typically charge percentage-based fees. Based on FY2025 reporting and common fee ranges, the following after-fee estimates are reasonable.
Estimated FY2025 net returns to members
| Fund type | Typical option | Gross return (est.) | Total fees (est.) | Net return |
|---|---|---|---|---|
| Industry fund | Balanced / Growth | ~9.5% – 10.5% | ~1.0% – 1.3% | ~8.2% – 9.3% |
| Retail fund | Balanced / Growth | ~9.0% – 10.0% | ~1.4% – 1.8% | ~7.2% – 8.6% |
Key insight:
Industry funds generally outperformed retail funds in FY2025 primarily due to lower fees, not because of significantly different investment allocations.
Where retail & industry funds invested in FY2025
Across APRA-regulated retail and industry funds, asset allocation remains broadly standardised.
Typical retail & industry fund asset allocation
| Asset class | Approximate allocation |
|---|---|
| International shares | 30% – 35% |
| Australian shares | 22% – 25% |
| Fixed interest (Aust & global) | 12% – 15% |
| Infrastructure & private assets | 10% – 15% |
| Property (listed & unlisted) | 7% – 10% |
| Cash | 5% – 8% |
International shares were the largest contributor to FY2025 performance, supported by global equity growth and currency movements.
SMSFs: average fees and asset allocation
Average SMSF fees
Unlike pooled funds, SMSFs generally operate on fixed annual fees.
| Cost component | Typical annual range |
|---|---|
| Accounting & tax | $1550 – $3000 |
| Audit | $400 – $700 |
| ASIC, ATO & admin | $200 – $400 |
| Total SMSF cost | ~$2,100 – $3,600 |
For a $500,000 SMSF, this equates to approximately 0.4% – 0.7% per annum, often materially lower than retail or industry fund fees at similar balances, noting that SMSF fees are all tax deductible.
Typical SMSF asset allocation
SMSFs look very different from retail and industry funds due to choice of investments and direct ownership.
| Asset class | Approximate SMSF allocation |
|---|---|
| Australian shares | 25% – 30% |
| Cash & term deposits | 15% – 20% |
| Direct property | 15% – 20% |
| International shares | 10% – 15% |
| Alternatives (gold, crypto, collectibles) | Remainder |
This flexibility allows tailored strategies, but also results in much wider performance dispersion between SMSFs, and higher risks.
SMSF asset performance in FY2025 (estimated)
Estimated SMSF asset class returns
| SMSF asset class | Typical SMSF role | Income return (est.) | Capital growth (est.) | Total FY2025 return (est.) | Risk profile |
|---|---|---|---|---|---|
| Property (direct residential / commercial) | Core / long-term | ~4% – 6% | ~0% – 4% | ~4% – 8% | Low–Medium |
| Bitcoin (held compliantly) | Satellite / growth | Nil | +80% – +130% | +80% – +130% | Very High |
| Gold (physical bullion or ETFs) | Defensive | Nil | +10% – +18% | +10% – +18% | Medium |
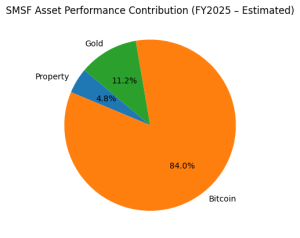
Commentary
-
Property remained a core SMSF holding in 2025, valued primarily for income stability, with rising inflation a key contributor to rental returns, with commercial property generally producing stronger yields than residential property.
-
Bitcoin delivered exceptional returns but with extreme volatility, reinforcing its role as a small, high-risk allocation, not a core asset suitable for most SMSFs
-
Gold and Silver performed strongly as a defensive hedge, supporting portfolio stability during periods of global uncertainty.
Retail & industry funds vs SMSFs: key differences
| Feature | Retail / Industry funds | SMSFs |
|---|---|---|
| Fees | Percentage-based | Mostly fixed |
| Asset choice | Limited | Broad & flexible |
| Property | Indirect only | Direct ownership |
| Bitcoin | Generally unavailable | Permitted (with rules) |
| Control | None | Full trustee control |
| Performance outcomes | Clustered near averages | Highly variable |
What 2025 means for trustees heading into 2026
-
Fees materially affect long-term outcomes
-
Asset allocation mattered more than fund branding or reputation
-
SMSFs reward discipline, diversification and not frequent trading
-
Choice and lower fees is the defining advantage of an SMSF, when appropriately managed
2025 demonstrated that SMSFs typically holding property, shares and cash can outperform retail and industry funds, significantly depending on trustee decisions, governance and strategy execution.
FAQs
What was the average super return in FY2025?
After fees, most retail and industry fund members received approximately 7.5% to 9% average returns
Did industry funds outperform retail funds?
Yes. The difference was driven largely by lower fees, not substantially different asset allocations.
Are SMSFs cheaper than retail or industry funds?
For balances above $200,000, SMSFs are often cheaper on a percentage basis, noting $1190 is My SMSFs basic fee
Can SMSFs invest in property, Bitcoin and gold?
Yes, provided the trust deed, investment strategy and compliance requirements are satisfied.
Related links
-
Speak to us about setting up or reviewing an SMSF:
👉 https://mysmsfproperty.com.au/contact-us-for-setups-and-support/ - APRA Superannuation Statistics (Official source)
https://www.apra.gov.au/quarterly-superannuation-statistics
- Chant West Super Fund Performance Reports
https://www.chantwest.com.au/super-funds/super-performance/
Performance Assumptions & Data Sources
Retail and industry superannuation fund performance references for FY2025 are informed by aggregated return data for balanced and growth investment options published by APRA-regulated superannuation funds, SuperRatings, and Chant West, reflecting net-of-fee returns to members where disclosed. Property return assumptions for SMSFs are derived from CoreLogic Hedonic Home Value Index, commercial property market summaries, and typical net rental yield ranges after costs, excluding leverage unless otherwise stated. Gold performance estimates reference World Gold Council annual price movements in AUD, excluding storage and insurance costs. Bitcoin performance ranges are based on observed AUD-denominated spot price movements across major exchange indices and reference rates, assuming compliant SMSF custody and no leverage. The SMSF return shown represents an illustrative, weighted outcome based on a diversified asset allocation and does not represent a median or average SMSF return as reported by the ATO. Actual outcomes will vary materially depending on asset selection, timing, liquidity management, transaction costs, tax position, compliance structure, and trustee decision-making.