
SMSF Share & ETF Investing and Trading Course
Secure your spot for $22 (once-off). After payment, we’ll email your login and unlock all lessons and the certificate.
You’re viewing a locked lesson preview. Purchase unlocks all 8 lessons, quizzes and the certificate.
Every successful SMSF portfolio starts with a clear understanding of its building blocks. In this lesson you will learn exactly what a share is, what an ETF is, how each behaves inside a super fund and why starting small is a genuine strategic advantage rather than a limitation. By the end of the lesson you will be able to explain the shares-versus-ETFs decision to a fellow trustee and sketch your first simple investment plan.
- Define shares and ETFs and describe how each generates returns
- Compare the risk, income, cost and diversification characteristics of shares and ETFs
- Explain the benefits of starting with small investments and compounding
- Draft a personal starting-investment plan for your SMSF
Estimated time: 60 minutes (40 min content, 10 min activity, 10 min assessment)
1.1 Introduction to Shares and ETFs
What Is a Share?
A share (also called a stock or equity) is a unit of ownership in a company. When your SMSF buys 100 shares in a company listed on the Australian Securities Exchange (ASX), the fund becomes a part-owner of that business. As an owner, the fund is entitled to a share of the company’s profits and, if the company is ever wound up, a claim on what remains after creditors are paid.
Shares reward investors in two ways:
- Capital growth. If the company prospers, other investors will pay more for its shares. Buy at $10.00 and sell at $13.00 and your fund has made a 30% capital gain (before costs and tax).
- Dividend income. Many established companies distribute part of their profits as dividends — in Australia, typically twice a year. Australian dividends frequently carry franking credits, which represent company tax already paid and are especially valuable in the low-tax super environment.
Your SMSF buys 500 shares in a major Australian bank at $32.00 per share — an investment of $16,000 plus about $20 brokerage. Over the year the bank pays a fully franked dividend of $1.60 per share and the share price rises to $34.00.
| Component | Calculation | Result |
|---|---|---|
| Capital gain | 500 × ($34.00 − $32.00) | $1,000 (6.25%) |
| Cash dividend | 500 × $1.60 | $800 (5.0%) |
| Franking credit (gross-up) | $800 × (30 ÷ 70) | ≈ $343 |
| Total economic return | $1,000 + $800 + $343 | $2,143 (≈13.4%) |
Inside an SMSF in accumulation phase, tax of 15% applies to the dividend plus franking credit (≈$171), which the franking credit more than covers. The excess offsets tax on other fund income or is refunded. This is why fully franked Australian shares are a mainstay of SMSF portfolios. In pension phase, the entire refund flows to the fund in cash.
What Is an ETF?
An Exchange-Traded Fund (ETF) is a managed investment fund whose units trade on a stock exchange just like a single share. One ASX-listed ETF might hold all 200 companies in the S&P/ASX 200 index; another might hold thousands of US and international companies; others hold bonds, gold, or cash-like securities. When your SMSF buys one unit of a broad index ETF, it instantly owns a tiny slice of every company in that index.
ETFs deliver:
- Instant diversification — one trade spreads your money across hundreds or thousands of holdings
- Low cost — index ETFs commonly charge management fees (MERs) of 0.03%–0.50% per year, versus 0.80%–1.50% for many actively managed funds
- Transparency — holdings and prices are published daily
- Liquidity — units can be bought or sold any time the market is open
ETFs pay distributions (their version of dividends) from the income their underlying holdings produce and index ETFs simply aim to match — not beat — their benchmark index.
Shares vs ETFs — Head-to-Head
| Comparison | Individual Shares | ETFs |
|---|---|---|
| What you own | A stake in one company | Units in a fund holding many assets |
| Diversification | None by itself — you must build it | Built-in, from the first unit |
| Return potential | Higher ceiling — a single great company can multiply | Market-like returns; outliers are diluted |
| Risk | Higher — one company’s failure can destroy the investment | Lower — single-company failures barely register |
| Income | Dividends declared by the company; often franked (AU) | Distributions from underlying holdings; franking passed through on AU equity ETFs |
| Ongoing fees | None (brokerage on trades only) | Management fee (MER) built into returns |
| Research effort | High — you must analyse each company | Low — index selection does the work |
| Voting & control | Shareholder voting rights | Fund manager votes on holdings |
| Typical role in an SMSF | Satellite holdings, income focus | Core portfolio building blocks |
Watch: Shares vs ETFs vs Managed Funds — the 60-second explainer
The trade-offs above, condensed into a 60-second stickman animation — and the 20-year fee-drag calculation that explains why ETFs are the SMSF workhorse:
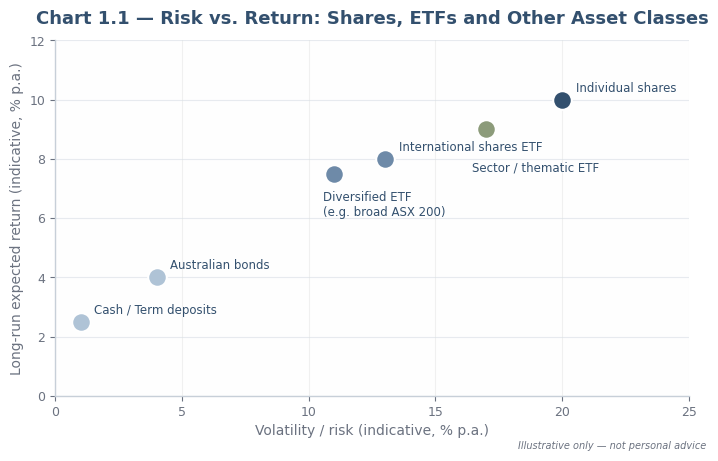
Chart — the risk/return trade-off
The chart below plots the classic investing bargain: to pursue higher returns you must accept higher volatility. Individual shares sit at the high-risk/high-potential end; diversified ETFs sit in the middle; cash and bonds anchor the low end.
1.2 Starting with Small Investments
Why Small Is Smart
Trustees are often surprised to hear that one of the best things a new SMSF investor can do is invest less than they can afford to. Starting small is not about timidity — it is a deliberate risk-management strategy with three concrete benefits:
- Lower risk exposure while you learn. A 20% paper loss on a $5,000 position is $1,000 — a cheap education. The same percentage loss on a $300,000 position is $60,000. Early mistakes are tuition; keep the fees low.
- Real learning requires real skin in the game. Simulated portfolios teach mechanics, but only real money teaches the emotional discipline — resisting panic-selling in a dip or greed-buying in a spike — that separates successful long-term investors from the rest.
- Dollar-cost averaging. Investing a fixed amount regularly (say, $1,000 each month or each quarter as contributions accumulate) means you automatically buy more units when prices are low and fewer when prices are high, smoothing your average entry price over time.
Your SMSF invests $1,200 into an ASX 200 ETF in three quarterly instalments of $400.
| Quarter | Unit Price | Amount Invested | Units Bought |
|---|---|---|---|
| Q1 | $50.00 | $400 | 8.00 |
| Q2 | $40.00 (market dips) | $400 | 10.00 |
| Q3 | $55.00 | $400 | 7.27 |
| Total / average | Average cost $46.96 | $1,200 | 25.27 units |
A single $1,200 purchase at $50.00 would have bought only 24.0 units. Investing in instalments bought 25.27 units at an average cost of $46.96 — because the dip in Q2 was an opportunity, not a disaster.
The Power of Compounding
Compounding — earning returns on your returns — is the engine of every long-term SMSF portfolio. The maths below shows why.
| Years | Value (no contributions added) | Growth Multiple |
|---|---|---|
| 5 | $14,026 | 1.4× |
| 10 | $19,672 | 2.0× |
| 15 | $27,590 | 2.8× |
| 20 | $38,697 | 3.9× |
| 25 | $54,274 | 5.4× |
| 30 | $76,123 | 7.6× |
The chart below shows what happens when small, regular amounts are added consistently — the strategy most SMSF members can actually follow, channelling contributions into the market over time.
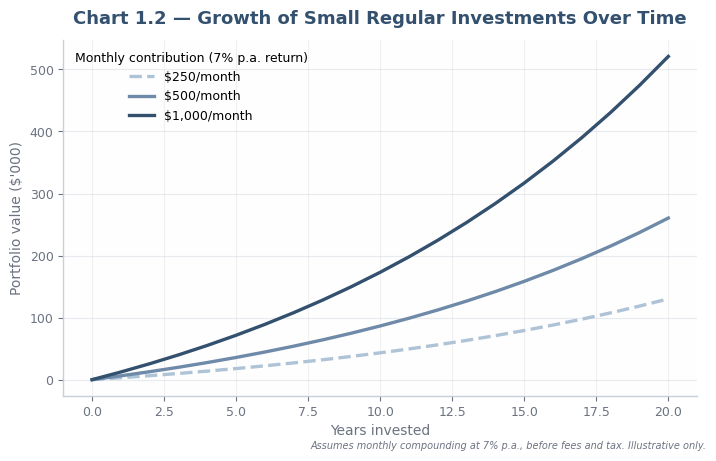
Divide 72 by your expected annual return to estimate how many years it takes to double your money. At 7% p.a., money doubles roughly every 10 years (72 ÷ 7 ≈ 10.3). At 4%, it takes about 18 years.
Lesson 1 Summary — Key Takeaways
- A share is part-ownership of one company; returns come from capital growth and dividends (often franked in Australia)
- An ETF is an exchange-traded fund offering instant diversification at low cost; returns track its underlying index or assets
- Shares offer a higher ceiling but require research and carry concentrated risk; ETFs offer built-in diversification and simplicity — most SMSFs use both
- Starting small caps the cost of early mistakes, builds genuine experience and enables dollar-cost averaging
- Compounding rewards time in the market above all else; the Rule of 72 tells you how fast money doubles
- Inside super, franking credits and the concessional 15%/10%/0% tax rates make the compounding engine run faster
Read the “Shares vs. ETFs” comparison on Investopedia, then list three ASX-listed companies and three ASX-listed ETFs you would consider for your fund, with one sentence on why each made your list.
Five multiple-choice questions testing your understanding of shares, ETFs, franking credits and compounding. Pass mark: 80%.
Finish Course Early?
You have not completed all required lessons and assessments.