

SMSF Share & ETF Investing and Trading Course
Secure your spot for $22 (once-off). After payment, we’ll email your login and unlock all lessons and the certificate.
You’re viewing a locked lesson preview. Purchase unlocks all 8 lessons, quizzes and the certificate.
With a strategy in place, the next question is what exactly do we buy? This lesson gives you a repeatable selection process: the criteria that matter when assessing any share or ETF, a simple scorecard to make decisions consistent and documentable and the two great schools of investment analysis — fundamental and technical. A documented, criteria-based process is not just good investing; it is good governance that your SMSF auditor will appreciate.
- Apply a structured set of criteria when selecting shares and ETFs
- Build and use a simple investment scorecard
- Distinguish fundamental analysis from technical analysis and know when to use each
- Read basic financial health indicators and a price chart
Estimated time: 60 minutes
3.1 Criteria for Selecting Shares and ETFs
Watch: The 5-part selection framework in 60 seconds
The 4-question stock screen, P/E ratio, ROE, ETF 3-filter selection and why you should always read the annual report — condensed into a 60-second stickman animation:
The Selection Funnel
Professional investors rarely analyse everything — they filter. A practical funnel for an SMSF trustee looks like this:
- Strategy fit first. Does the candidate fill a role in your core-satellite plan (Lesson 2)? If not, stop here.
- Quality screen. Apply the criteria below to weed out weak candidates.
- Valuation check. Even a great company is a bad investment at the wrong price.
- Size and document. Decide the position size, record the reasoning in trustee minutes.
Key criteria — what to check and why
| Criterion | What to Look For (Shares) | What to Look For (ETFs) |
|---|---|---|
| Financial health | Rising revenue and profit, healthy margins, manageable debt | Not applicable at fund level — check index quality instead |
| Sector trends | Industry growing; company holds or gains market share | Sector/theme has a durable long-term driver, not a fad |
| Valuation | P/E and dividend yield reasonable versus history and peers | Valuation of underlying index; avoid buying at obvious peaks |
| Fees / cost | Brokerage only | MER (aim low for core: under ~0.30%); check buy/sell spread |
| Management quality | Experienced, aligned leadership with a track record | Reputable issuer; fund accurately tracks its index (low tracking error) |
| Liquidity | Adequate daily trading volume | Reasonable on-screen volume and tight spreads; decent fund size (FUM) |
| Income & franking | Sustainable dividend, franking level | Distribution yield and franking passed through for AU equity ETFs |
| Risk | Earnings stability, balance-sheet strength | Concentration of the index (top-10 weight), currency exposure |
The investment scorecard
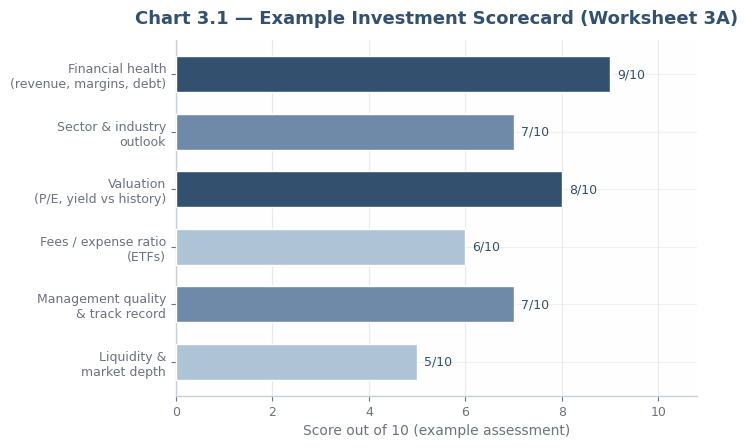
To keep decisions consistent — and auditable — score each candidate out of 10 on the criteria that matter most to your strategy. The chart below shows a worked example for a hypothetical candidate. In your assessment worksheet you’ll score one of your own:
The 8 financial ratios that matter
Every serious stock analysis starts with these ratios. You do not need to be an accountant — just know what green, amber and red look like for each:
| Ratio | What it means | Green ✅ | Amber ⚠️ | Red 🚩 |
|---|---|---|---|---|
| P/E ratio (Price ÷ EPS) | How much you pay per $1 of profit | < 15 | 15–25 | > 25 |
| ROE (NPAT ÷ equity) | Return on shareholder capital | > 15% | 8–15% | < 8% |
| Debt / equity | Leverage — how loaded up on debt | < 0.5 | 0.5–1.5 | > 1.5 |
| Revenue growth (5-yr CAGR) | Top-line growth trend | > 8% p.a. | 3–8% p.a. | < 3% / neg. |
| Dividend yield | Income return | 4–6% franked | 2–4% / 6–8% | < 1% / > 10% |
| Dividend cover (EPS ÷ DPS) | How safe the dividend is | > 1.75x | 1.25–1.75x | < 1.25x |
| Current ratio | Short-term liquidity | > 1.5 | 1.0–1.5 | < 1.0 |
| FCF yield | Real cash generation | > 6% | 3–6% | < 3% / neg. |
On a $200,000 core holding earning 7% gross, a 1.00% MER leaves 6.0% net (grows to ≈ $358,000 in 10 years), while a 0.10% MER leaves 6.9% (≈ $390,000). The fee difference alone costs roughly $32,000 over a decade — a powerful argument for low-cost core ETFs.
3.2 Fundamental and Technical Analysis
Fundamental Analysis — What Is the Business Worth?
Fundamental analysis evaluates a company’s (or index’s) underlying financial health and future prospects to estimate what the investment is worth. Fundamental investors ask: “Is this a good business and is the price fair?”
Core tools include:
- Financial statements — revenue, profit, cash flow, debt (found in annual/half-year reports)
- Ratios — price-to-earnings (P/E), dividend yield, return on equity (ROE), debt-to-equity
- Qualitative factors — competitive advantage (“moat”), management, industry position
Fundamental analysis suits long-term investors — which is most SMSF trustees most of the time.
Technical Analysis — What Is the Price Telling Us?
Technical analysis studies price charts and trading volume to identify trends, momentum and likely turning points. Technical traders ask: “What is the market doing and when should I act?”
Core tools include:
- Trend lines and moving averages — is the price trending up, down or sideways?
- Momentum indicators — e.g. Relative Strength Index (RSI), which flags overbought (typically above 70) and oversold (below 30) conditions
- Volume analysis — rising volume confirms the strength of a price move
Technical analysis suits timing decisions — when to enter or exit a position your fundamental analysis has already selected.
Comparison of Fundamental and Technical Analysis
| Aspect | Fundamental Analysis | Technical Analysis |
|---|---|---|
| Core question | What is it worth? | When should I trade? |
| Focus | Company health, earnings, growth | Price patterns, trends, momentum |
| Key inputs | Financial statements, ratios, industry data | Charts, moving averages, RSI, volume |
| Time horizon | Months to years | Days to months |
| Best SMSF use | Selecting what to buy for the portfolio | Timing entries, exits and stop levels |
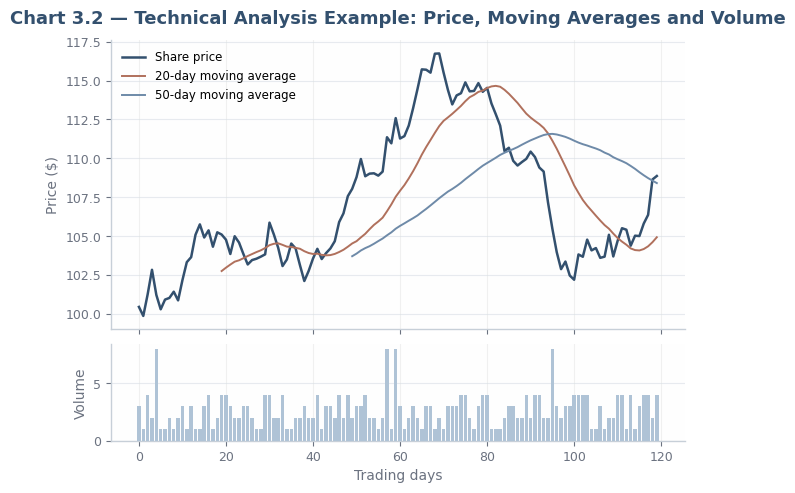
Putting them together. A practical SMSF workflow: use fundamental analysis to choose investments for the satellite portfolio, then use basic technical analysis (trend and moving averages) to time entries — for example, building a position during a pullback in a long-term uptrend rather than chasing a spike.
Lesson 3 Summary — Key Takeaways
- Use a selection funnel: strategy fit → quality screen → valuation → size and document
- Assess shares on financial health, sector trends, valuation, management, liquidity and income; assess ETFs on index quality, MER, tracking, liquidity and concentration
- The 8-ratio cheat sheet and a simple scorecard make decisions consistent, comparable and auditable
- Fundamental analysis answers “what to buy”; technical analysis answers “when to act” — most SMSF trustees lead with fundamentals
- Low fees compound in your favour; a 1% fee difference can cost tens of thousands over a decade
Read How to Choose Stocks and How to Select the Right ETF on Investopedia. Then create a shortlist of three shares and three ETFs; score each on the criteria above and rank your shortlist.
Multiple-choice questions on the selection criteria and the difference between fundamental and technical analysis, plus submission of your scored shortlist.
Finish Course Early?
You have not completed all required lessons and assessments.